| Subject: |
RE: Initial use of Resource Manager self-monitoring |
| Author: |
Jane Curry |
| Posted: |
2018-07-31 12:52 |
Presumably this is for Resource Manager - ie. paying customers - only?
Is there a version for Core? Is there likely to be?
Jay - what will be the status of your ZenPack with regard to Core?
Cheers,
Jane
------------------------------
Jane Curry
Skills 1st United Kingdom
jane.curry@skills-1st.co.uk
------------------------------
| Subject: |
RE: Initial use of Resource Manager self-monitoring |
| Author: |
Luke Lofgren |
| Posted: |
2018-07-31 17:31 |
From Jay:
container memory usage
zope memory usage
zope threads
zenhub worklists
datapoint rate on collector daemons
queued tasks on collector daemons
running tasks on collector daemons
modeling rate on zenmodeler
messages in rabbit queues
I didn't mess with container/zope memory usage; I'm tempted to start using the "restart when reaches percentage" option in CC 1.5.1, but not for zope, instead for zenhub (since I run multiple), and other collector -related things. I don't want to kick a zope out from under a user -- and they're getting restarted daily per another thread on here.
I did set one on zope threads (e.g. tell me if its zero). ZenHub worklists I set a duration one to find when config pushes have been going on too long and some max ones based on 2 week history.
Datapoint rate was overwhelming for collectors, but I went ahead and built two separate upper/lower bound thresholds (could probably make one) where the upper bound is a trigger for me to raise the lower bound. If the lower bound alerts, then it might be a problem or it might be "drift" or an even more dramatic change in what's being collected. This is the least "reliable" threshold value. Couldn't find that Zenoss had something I could use to auto-trend.
Queued tasks I had nothing bad in 2 weeks, so I said over 20 and I want to know about it. Running tasks I've had a variety of occurrences so 35 is the value I used for that (across all containers).
Modeling rate was interesting because it seemed only to be about finding out that we weren't modeling -- before the efficiency improvements in 6.2.0 (or whatever it was between that and 5.3.3) we had upped the amount of parallel modeling going on so much that modeling is now a fairly short duration. We went ahead and left that and I tried to craft some thresholds that would tell me if it slowed down and/or wasn't running. Couldn't think of a way to use the existing metrics to alert if there was a drop in the total amount that were modeled in 24 hours.
Messages in Rabbit queues I set and across-the-board maximum of 500 or something like that. I think I did something else with Rabbit (Durable Queues), but I don't remember. I also set something for the quantity in Redis.
Thanks for the guidance!!!!
------------------------------
Luke Lofgren
------------------------------
| Subject: |
RE: Initial use of Resource Manager self-monitoring |
| Author: |
Jay Stanley |
| Posted: |
2018-08-01 08:23 |
@Jane, it will still be released because it is mostly just templates. There are some patches in it, but I don't foresee an issue.
@Luke, yeah, my thresholds are a bit more extreme and are more focused on larger environments. For example, my queued tasks is around 500 by default. Also, I restart zope as well, but still alert on the memory usage because it will tell me if one zope is getting out of control or maybe the restarts arent working (Unlikely, but you never know)
I found a few things I want to change, the first run is a bit noisy.
------------------------------
jstanley
------------------------------


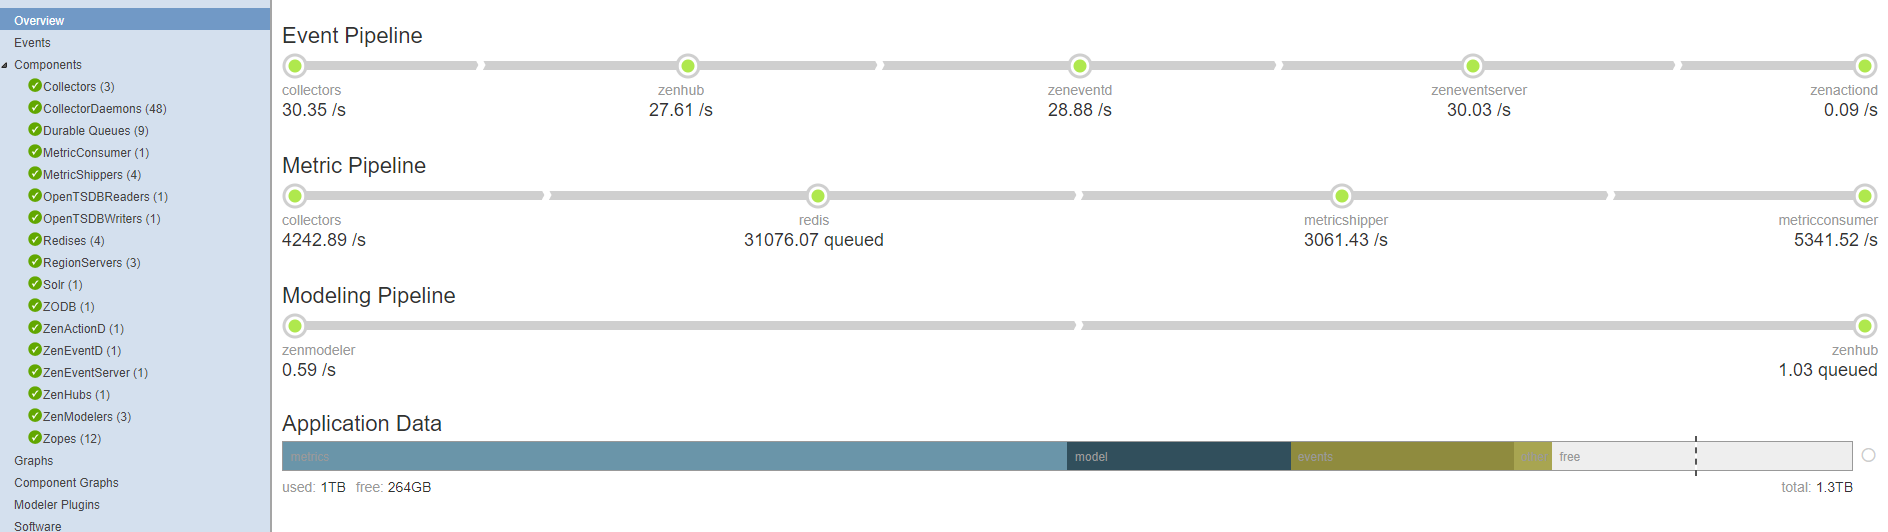 Nice that I started out all "green"; would love to compare ours with others.