Network graph display average value on custom interval
Subject:
Network graph display average value on custom interval
Author:
Neuromancer
Posted:
2017-07-21 10:54
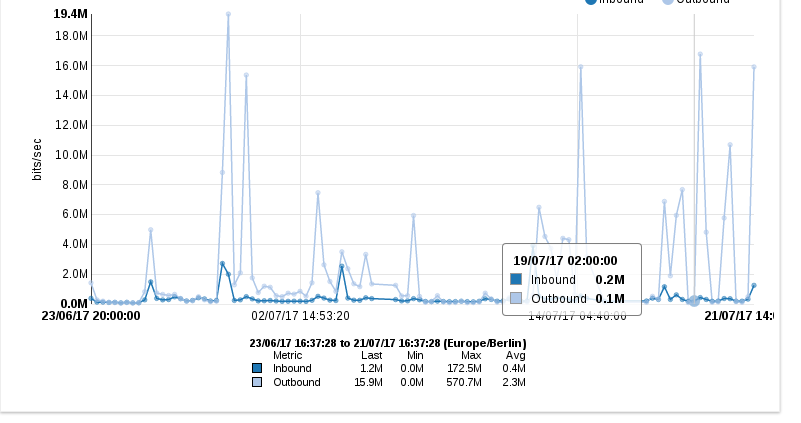
Hi All,
sorry in advance if it's the wrong place, I have strange behavior on network graph (router/switch interfaces or server interface). Selecting a custom time interval the graph show the average value, as example I have a host that in the last hour reached a throughput of 145 Mb/sec, on the same graph, If I choose as example "last 30 days" max graph value drop to average value making the graph rather useless. Every other graph (CPU, file systems and so on) is fine.