| Subject: |
RE: How to generate any metrics |
| Author: |
Michael Rogers |
| Posted: |
2021-09-28 13:25 |
Stefan,
It looks like you've bound several templates directly to this device? Those templates may use different methods to gather metrics, depending on what they gather.
I'll take them in order, as listed on the bottom left of your image:
Device (/) - This is the root level "Device" template. It is SNMP based and only gathers the sysUpTime OID. It has no graph definition (since graphing uptime just results in a line moving from lower-left to upper-right, unless the system reboots).
dsf (Locally Defined) - This appears to be a user-created template. Since I don't know what datasource you have defined on the template, I can't really say what it does.
HttpMonitor - This is the built-in HTTP monitor template. By default, it performs an HTTP GET against the hostname or managed IP address of the device it is bound to.
Java - This will require configuring the zJmxUsername and zJmxPassword configuration properties (or configuring the password directly on the datasource).
NTP - Polls the device on the standard NTP port.
ZenJMX - This is essentially a duplicate of the Java template. The linked documentation on this line provides instructions for configuring a JMX listener to convern JMX notifications and convert them into Zenoss events.
It also appears that the device you've bound these templates to is your Control Center host? I would recommend moving this device from the /HTTP device class to either the /Server/Linux or /Server/SSH/Linux device class.
/Server/Linux performs SNMP-based monitoring and can be configured with as little as an SNMP community string. On the device (or on the /Server/Linux device class itself), you would configure the zSnmpCommunity property. Instructions can be found
here.
/Server/SSH/Linux performs monitoring by running commands over an SSH connection and parsing out the metrics. It provides greater detail than the /Server/Linux device class. To configure, you would need to set a zCommandUsername and zCommandPassword. Key-based authentication is also available, but it takes a few more steps to configure. Instructions can be found
here.
This section of the documentation explains how to use configuration properties (also called "zProperties" or "zProps," since they all start with a lowercase "z"). The section on inheritance and override is especially important. This will allow you to set your values at the device class level so that all devices in the class inherit those values. You
could set the same properties over and over again on every single device, but that gets tedious pretty quickly.
If you add a device and Zenoss has trouble monitoring it, you should receive events on that device detailing the issue. In the image you attached, these events can be found in the following locations:
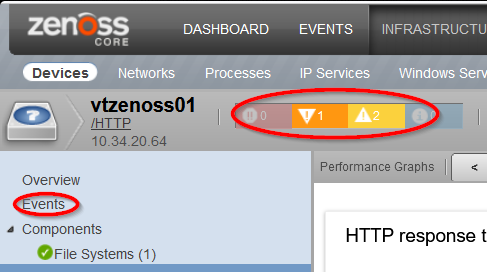
I hope this helps and please let us know how things go?
------------------------------
Michael J. Rogers
Senior Instructor - Zenoss
Austin TX
------------------------------
| Subject: |
RE: How to generate any metrics |
| Author: |
Stefan Hristov |
| Posted: |
2021-09-30 02:48 |
Hi Mike,
this info is very helpful, thanks.
Finally I managed to pull some metric data for Windows devices - here is my main question: basically do I understand well the concept -> I need to select a specific device and then according the assigned (bound( templates the appropriate metric data should show up?
So if there 10 devices in total and if I want to get all available metric data (datapoints) using the available JSON API should I do it like this:
- run a request to get all 10 devices - via "action":"DeviceRouter", "method":"getDevices", "data":[{"uid":"/zport/dmd/Devices/" ?
- request to check what are the assigned templates for the selected device - what should be the request body
- run requests for each type of metrics - what should be the request body
Thanks in advance Mike.
------------------------------
Stefan Hristov
Integration Engineer
------------------------------
| Subject: |
RE: How to generate any metrics |
| Author: |
Michael Rogers |
| Posted: |
2021-10-05 13:29 |
Stefan,
Once you have devices added to their appropriate device classes, it should be easy enough to look at the templates (inherited from the device class) to determine the data point names.
Data point names will change from class to class based on the monitoring protocol used. For instance, the 5 minute load average for /Server/Linux devices is
laLoadInt5.laLoadInt5. For /Server/SSH/Linux, this same load average is stored as
uptime.laLoadInt5. This is because the SNMP-based class polls a single SNMP OID, while the SSH-based class executes the
uptime command and parses out the values.
To see how to formulate the metric API request (and where to send it), you can use your browsers development console and watch the requests sent while viewing a device's graphs page. The request will consist of a start and stop time, followed by one or more metrics. Depending on the graph settings at the time of the request, some of the options in the request can change. For instance, here's a request payload as seen in the Chrome DevTools:
{"start":1633450688849,"end":1633454288849,"series":true,"downsample":"10s-max","tags":{},"returnset":"EXACT","metrics":[{"metric":"prox1.domain.tld/uptime_laLoadInt15","id":"9x9D9TKSXC","rate":false,"rateOptions":{},"aggregator":"avg","tags":{"key":["Devices/prox1.domain.tld"]},"name":"15 Minute"},{"metric":"prox1.domain.tld/uptime_laLoadInt5","id":"kNg36wG7X9","rate":false,"rateOptions":{},"aggregator":"avg","tags":{"key":["Devices/prox1.domain.tld"]},"name":"5 Minute"},{"metric":"prox1.domain.tld/uptime_laLoadInt1","id":"StjD63BiB0","rate":false,"rateOptions":{},"aggregator":"avg","tags":{"key":["Devices/prox1.domain.tld"]},"name":"1 Minute"}]}
As you can tell by the metric names, this devices is in the /Server/SSH/Linux device class.
I hope this helps!
------------------------------
Michael J. Rogers
Senior Instructor - Zenoss
Austin TX
------------------------------

