| Subject: |
RE: Zenoss Core 6.2.3 runaway memory |
| Author: |
Michael Rogers |
| Posted: |
2020-07-13 14:53 |
Daniel,
Your best move will be to determine what's consuming the memory on your Control Center host. If you're not already doing so, add the CC master to the /ControlCenter device class and let it self monitor for a few hours/days. Once you have some data built up, you can use the Component Graphs option of your CC device to see all the running services in one place:
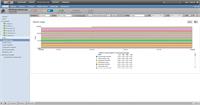
Choose the CC-Service component, the Memory Usage graph, and then check "all on same graph." This will result in a very busy graph, but if any service is showing a large spike in memory consumption, it should appear as a widening track on the graph.
(Note: my image above only shows 15 minutes of gathered data as I didn't want to wait a full day to get you a "better" graph. For your investigation, you will likely need more data than I'm demonstrating here.)
Since each service will list two data points ("Total RSS" and "Cache"), your graph may be difficult to read. For my lab system, 67 CC-Services * 2 data points = 174 graph points. If yours is similar, remember that you can hide data points by clicking on them in the graph legend.
Once you have the memory consumption narrowed down to a service or two, let us know your findings?
------------------------------
Michael J. Rogers
Senior Instructor - Zenoss
Austin TX
------------------------------
| Subject: |
RE: Zenoss Core 6.2.3 runaway memory |
| Author: |
Daniel Vogel |
| Posted: |
2020-07-14 07:47 |
Michael,
Sorry, I updated to version 6.3.2 not 6.2.3.
I think the Control Center ZenPack is "Commercial" and not available with Zenoss Core.
The Control C
enter GUI itself has performance graphics. I think I can have a try with this?
Thanks,
Daniel------------------------------
Daniel Vogel
IT Infrastructure Architect
ABC Systems AG
Schlieren
------------------------------
| Subject: |
RE: Zenoss Core 6.2.3 runaway memory |
| Author: |
Daniel Vogel |
| Posted: |
2020-07-14 07:56 |
...one thing more.
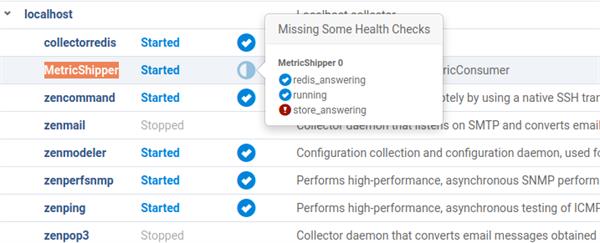
I see with the Control Center some missing health check with "MetricShipper".
It's very difficult to start this service successful.
------------------------------
Daniel Vogel
IT Infrastructure Architect
ABC Systems AG
Schlieren
------------------------------
| Subject: |
RE: Zenoss Core 6.2.3 runaway memory |
| Author: |
Michael Rogers |
| Posted: |
2020-07-15 13:35 |
Daniel,
My apologies! I was in such a rush to respond that I forgot the CC ZenPack wasn't Open Source.
You absolutely can use the graphs in CC to determine which service/container is chewing up your RAM. The memory utilization metrics shown in CC are the same ones polled by the CC ZenPack, so the data is fine (if slightly more tedious to inspect).
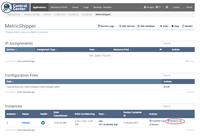
If you click on the MetricShipper service name, its overview page in CC should provide you with a link to its logs:
------------------------------
Michael J. Rogers
Senior Instructor - Zenoss
Austin TX
------------------------------