

|
|
| Subject: | Monitoring Template not working |
| Author: | Tim Meads |
| Posted: | 2019-08-14 00:16 |
| Subject: | RE: Monitoring Template not working |
| Author: | Tim Meads |
| Posted: | 2019-08-14 11:30 |
I spent several hours digging and I cannot find a single reason to why my system isn't pulling any custom snmp data.....It's not getting anything from monitoring templates.
I adjusted the iptables rules to allow all SNMP.....but I'm not 100% convinced that this is working correctly....it acts like either the modeler is not able to crunch the data or the data isn't coming in. Maybe it's a permissions issue for the file system? I can't see anywhere in any logs where it's stopping writing or anything tho....
| Subject: | RE: Monitoring Template not working |
| Author: | Jane Curry |
| Posted: | 2019-08-15 04:23 |
| Subject: | RE: Monitoring Template not working |
| Author: | Tim Meads |
| Posted: | 2019-08-15 11:45 |
I suppose I should have left more info.
Zenoss version 6.2.1.
I can run the desired snmpwalk command from the CLI without issue. When I go into the template and go to the spot where the OID is, I can put the address in of the device and hit test and it comes back with the proper polled snmp entry.
For example, or to make it clearer, what I'm trying to do is monitor the number of station counts on PtMP wireless radios. Before I had the crash, I had it setup to where if one of the radios had 0 registered clients on it, it would send me an error letting me know that the radio has no clients on it.
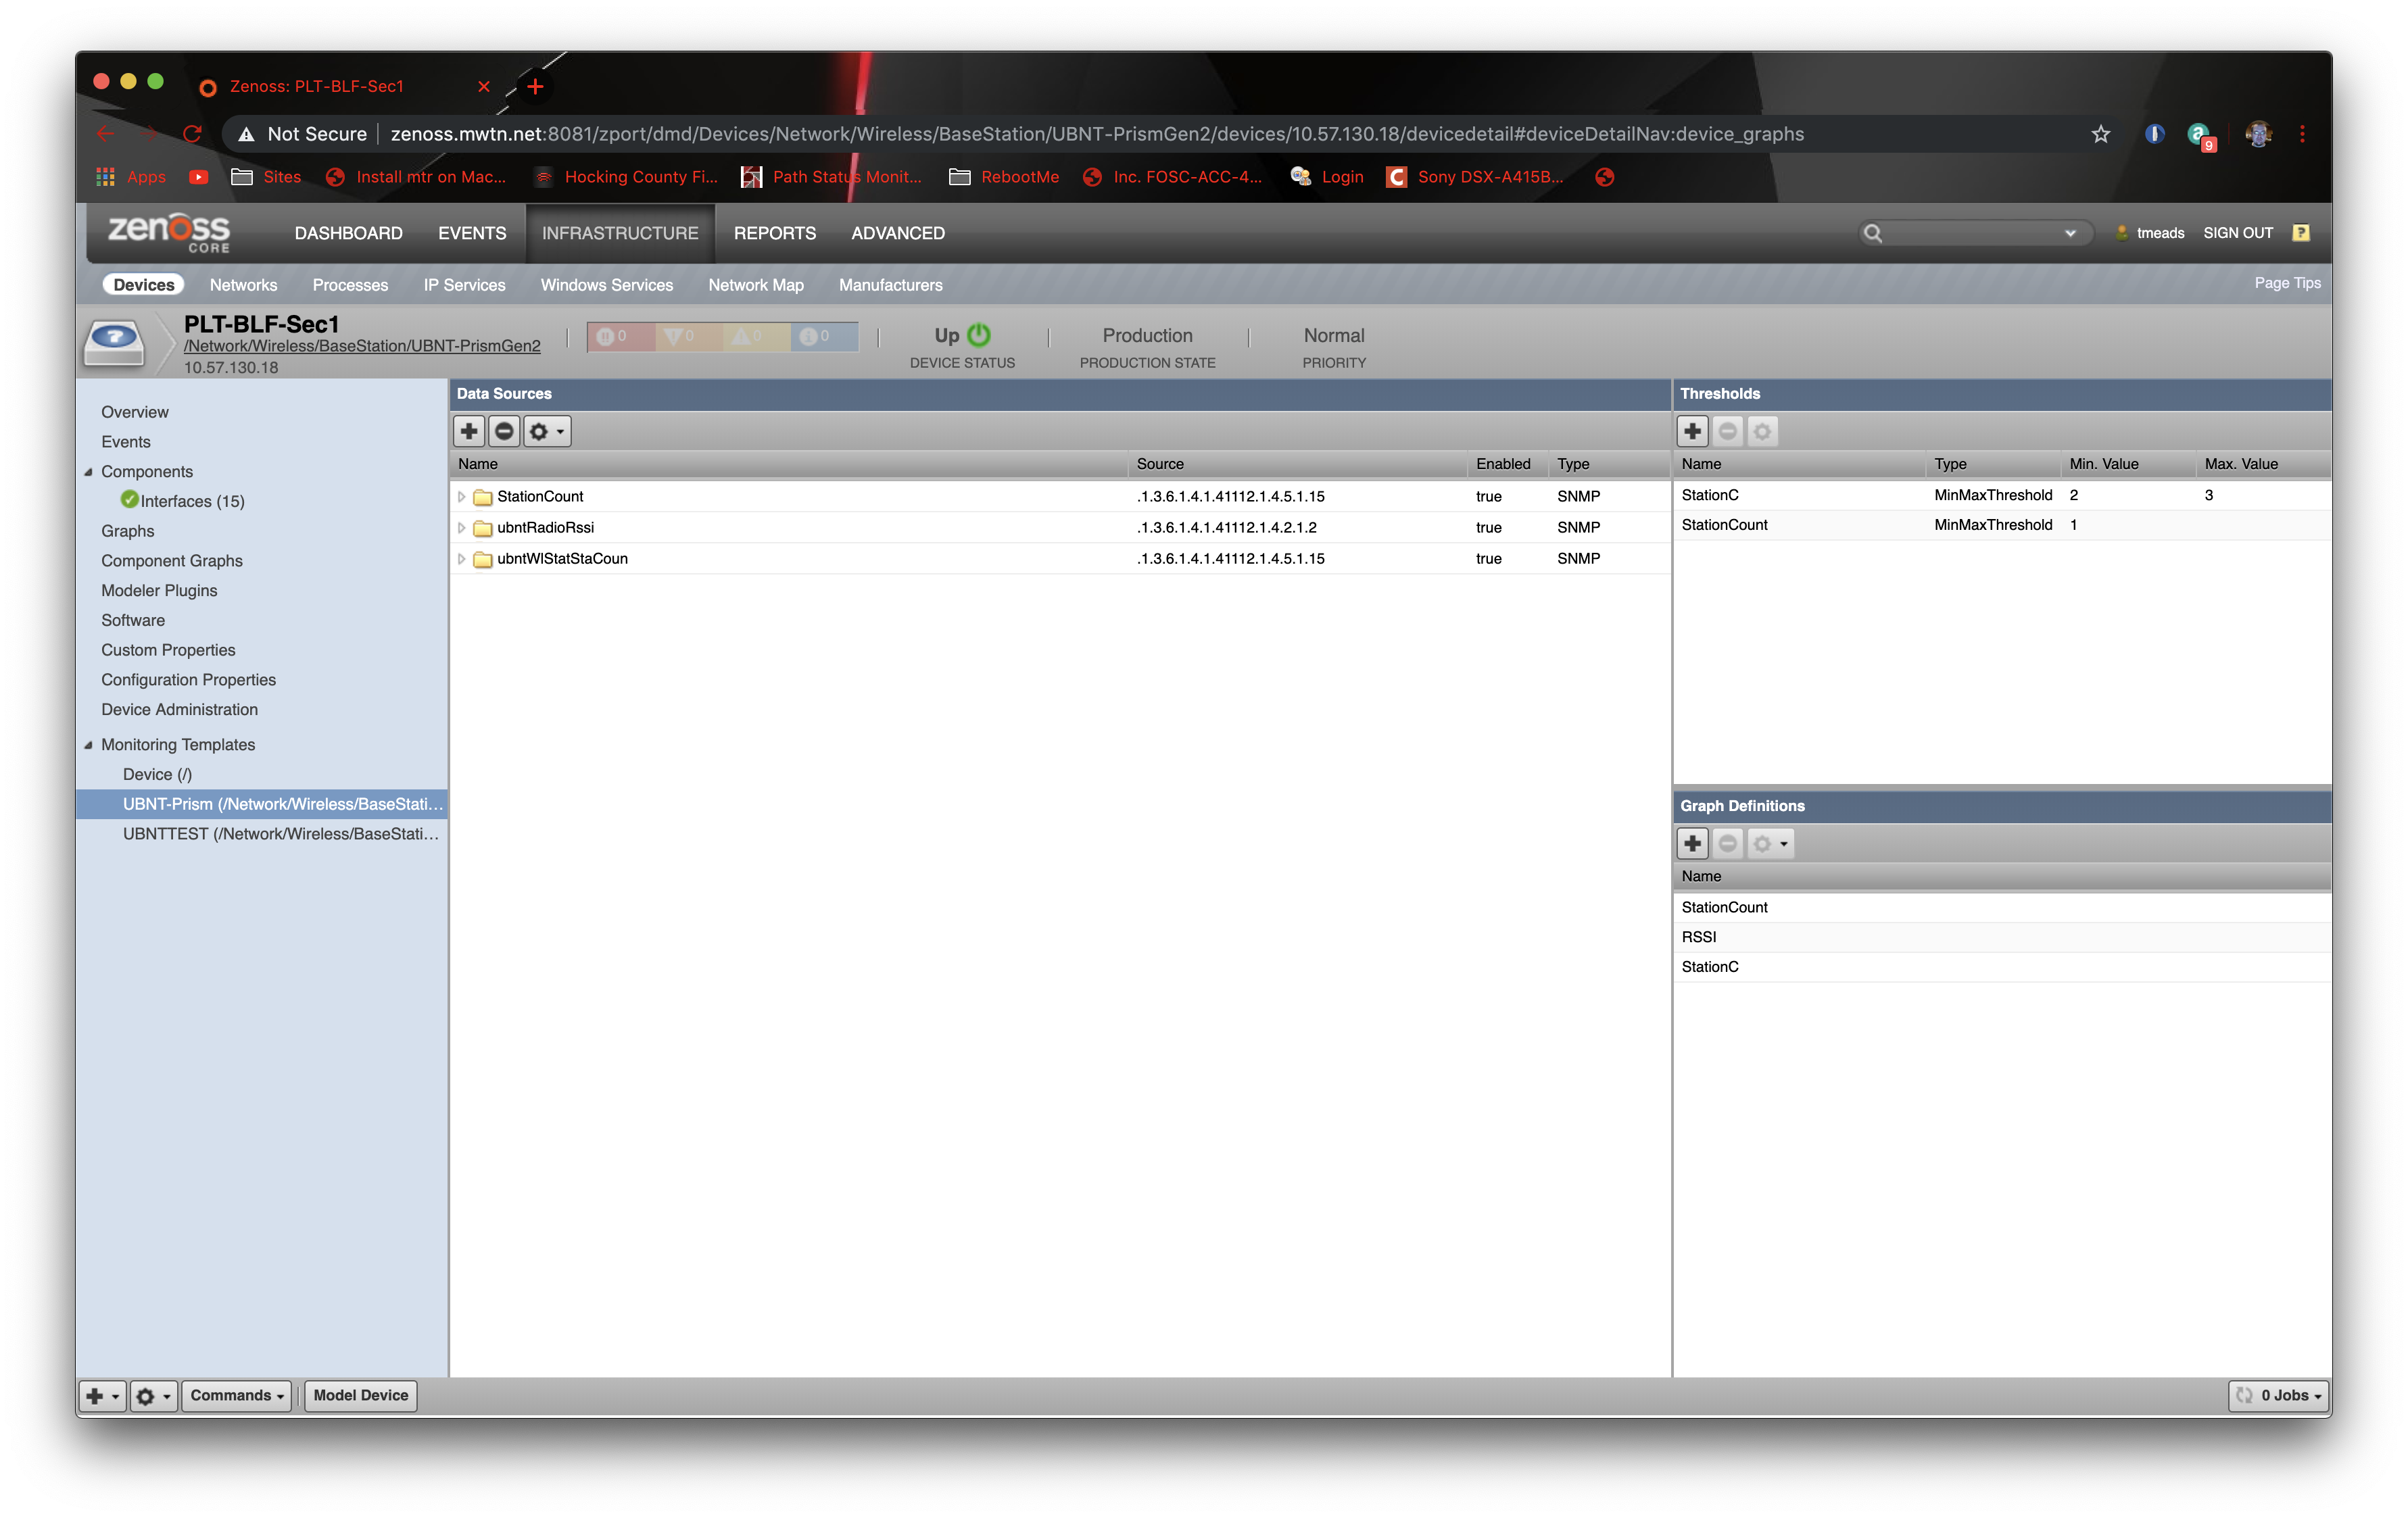
To achieve this, I'd go into monitoring templates, setup a template and bind it to the a device class the radio is in. I would create the data point, enter the oid info, set a minmax threshold. If I wanted to verify the data I would setup a graph to show me the number of clients etc.
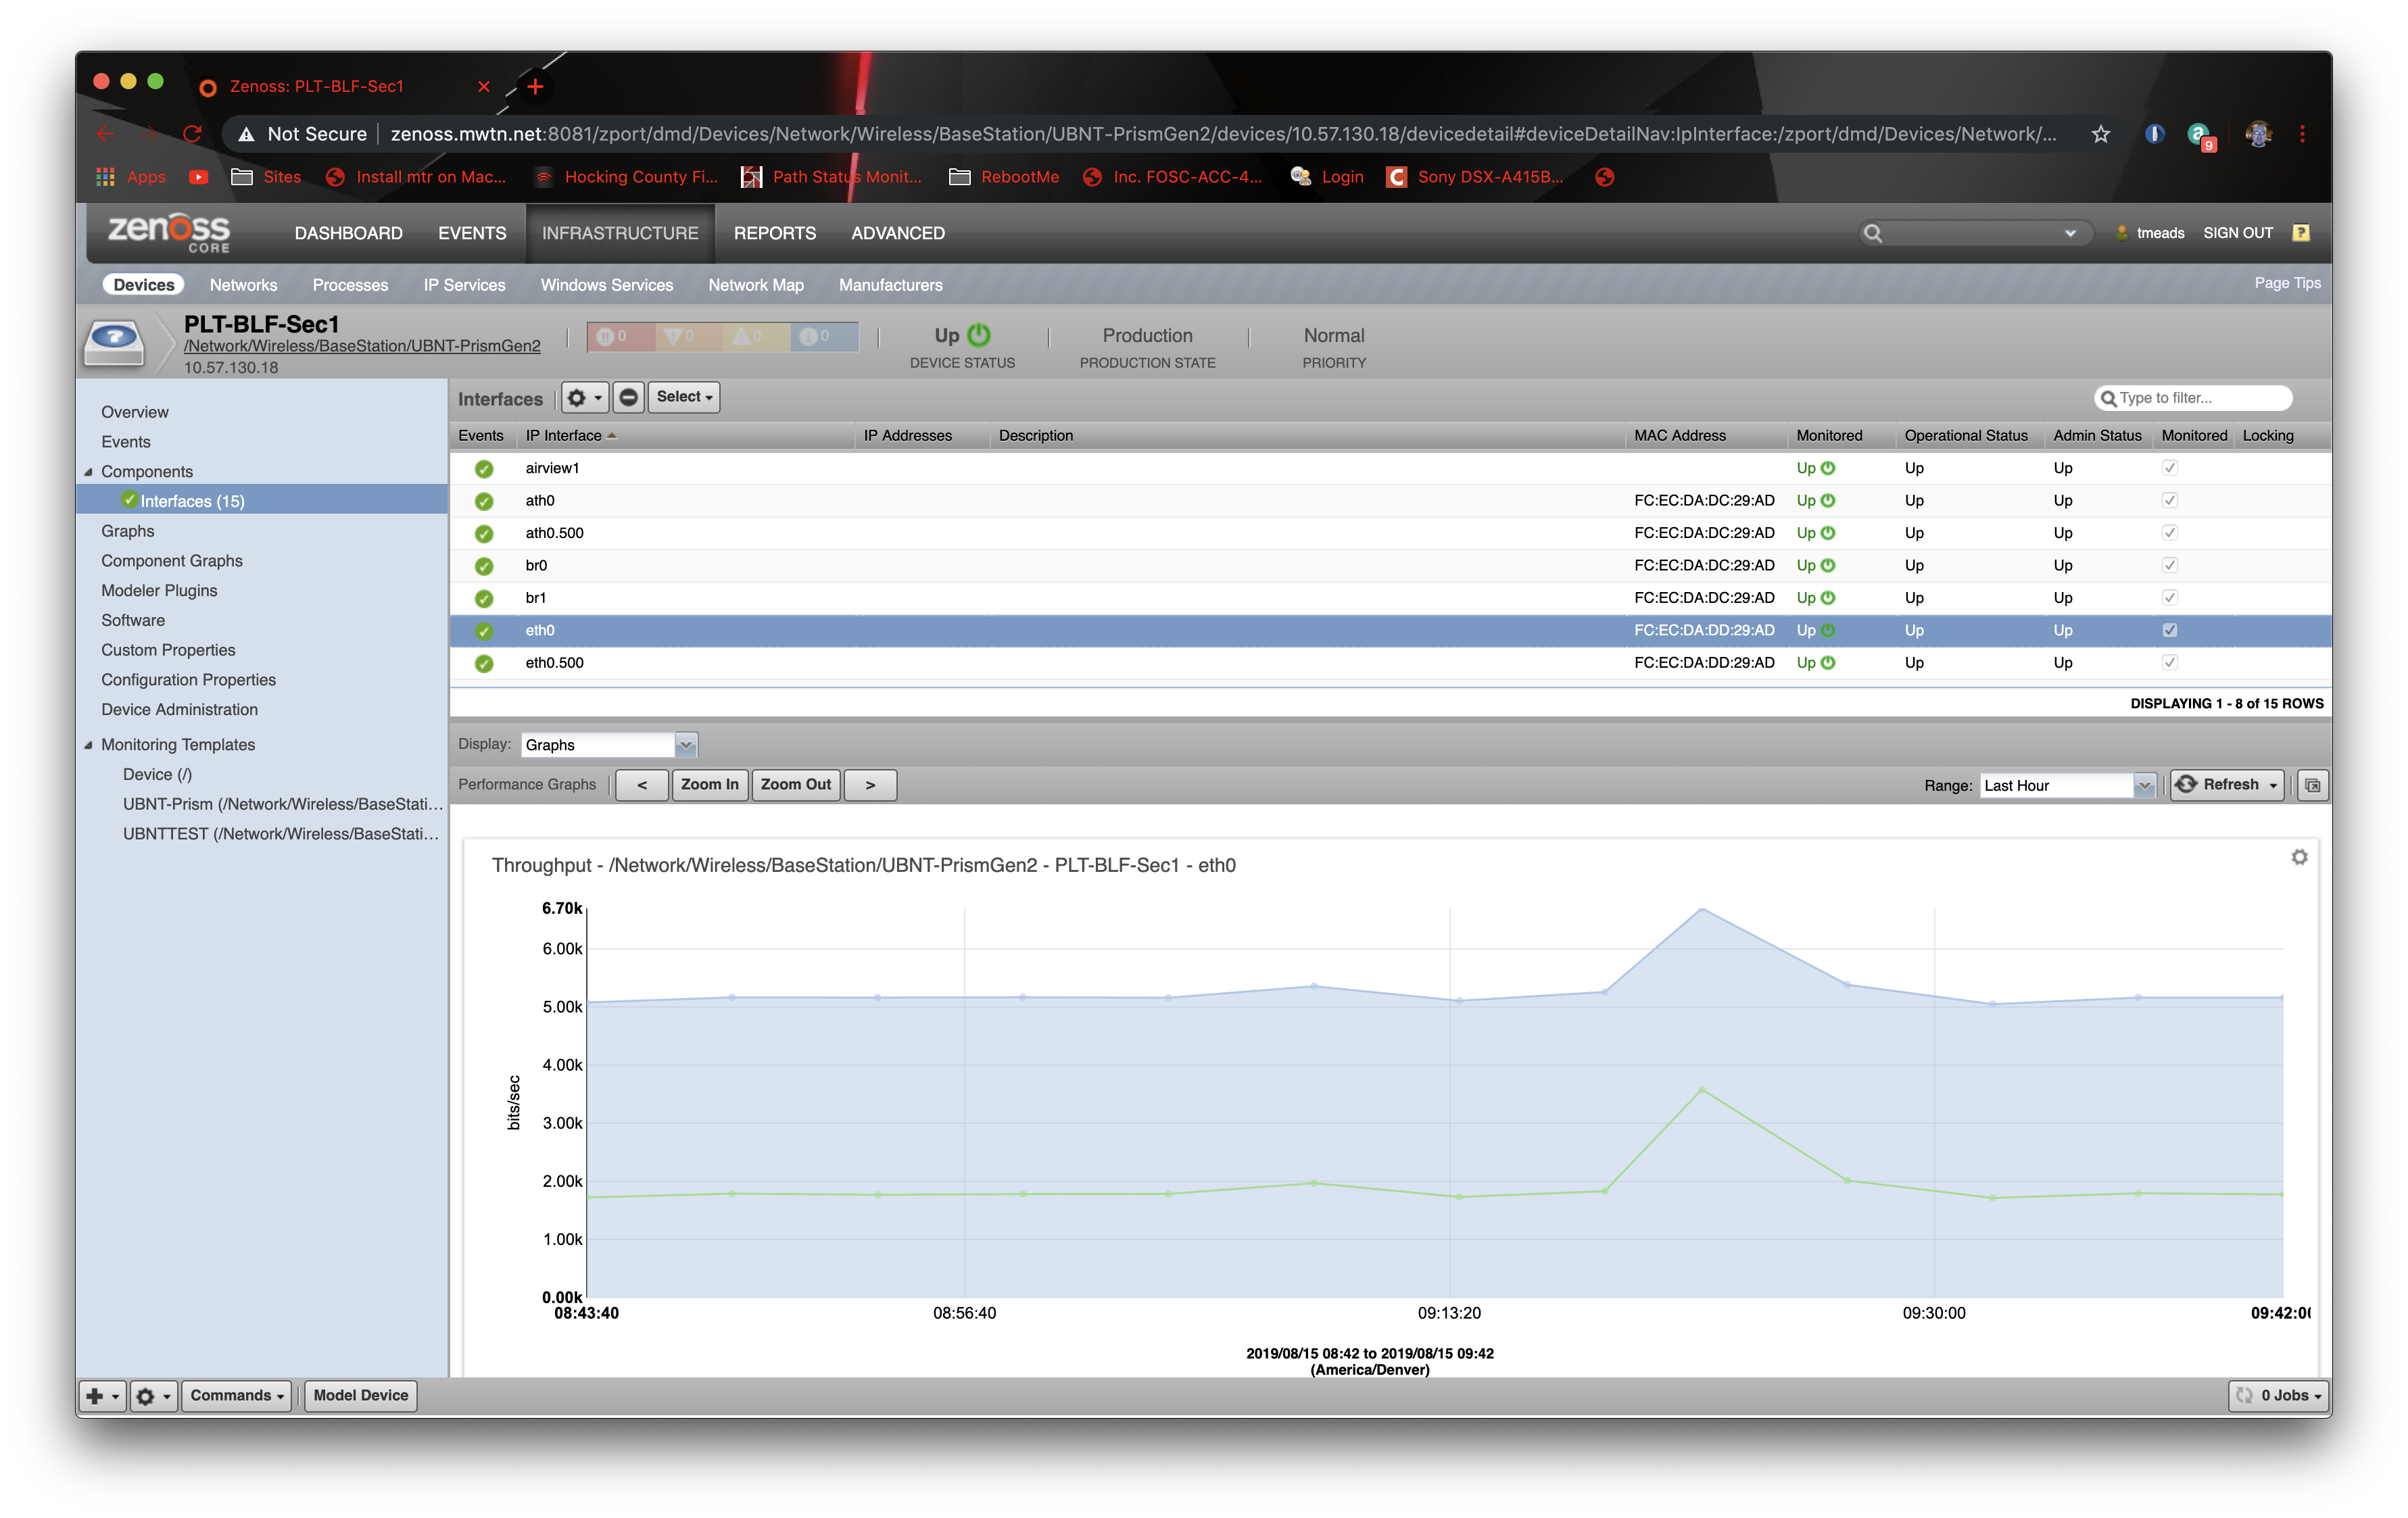
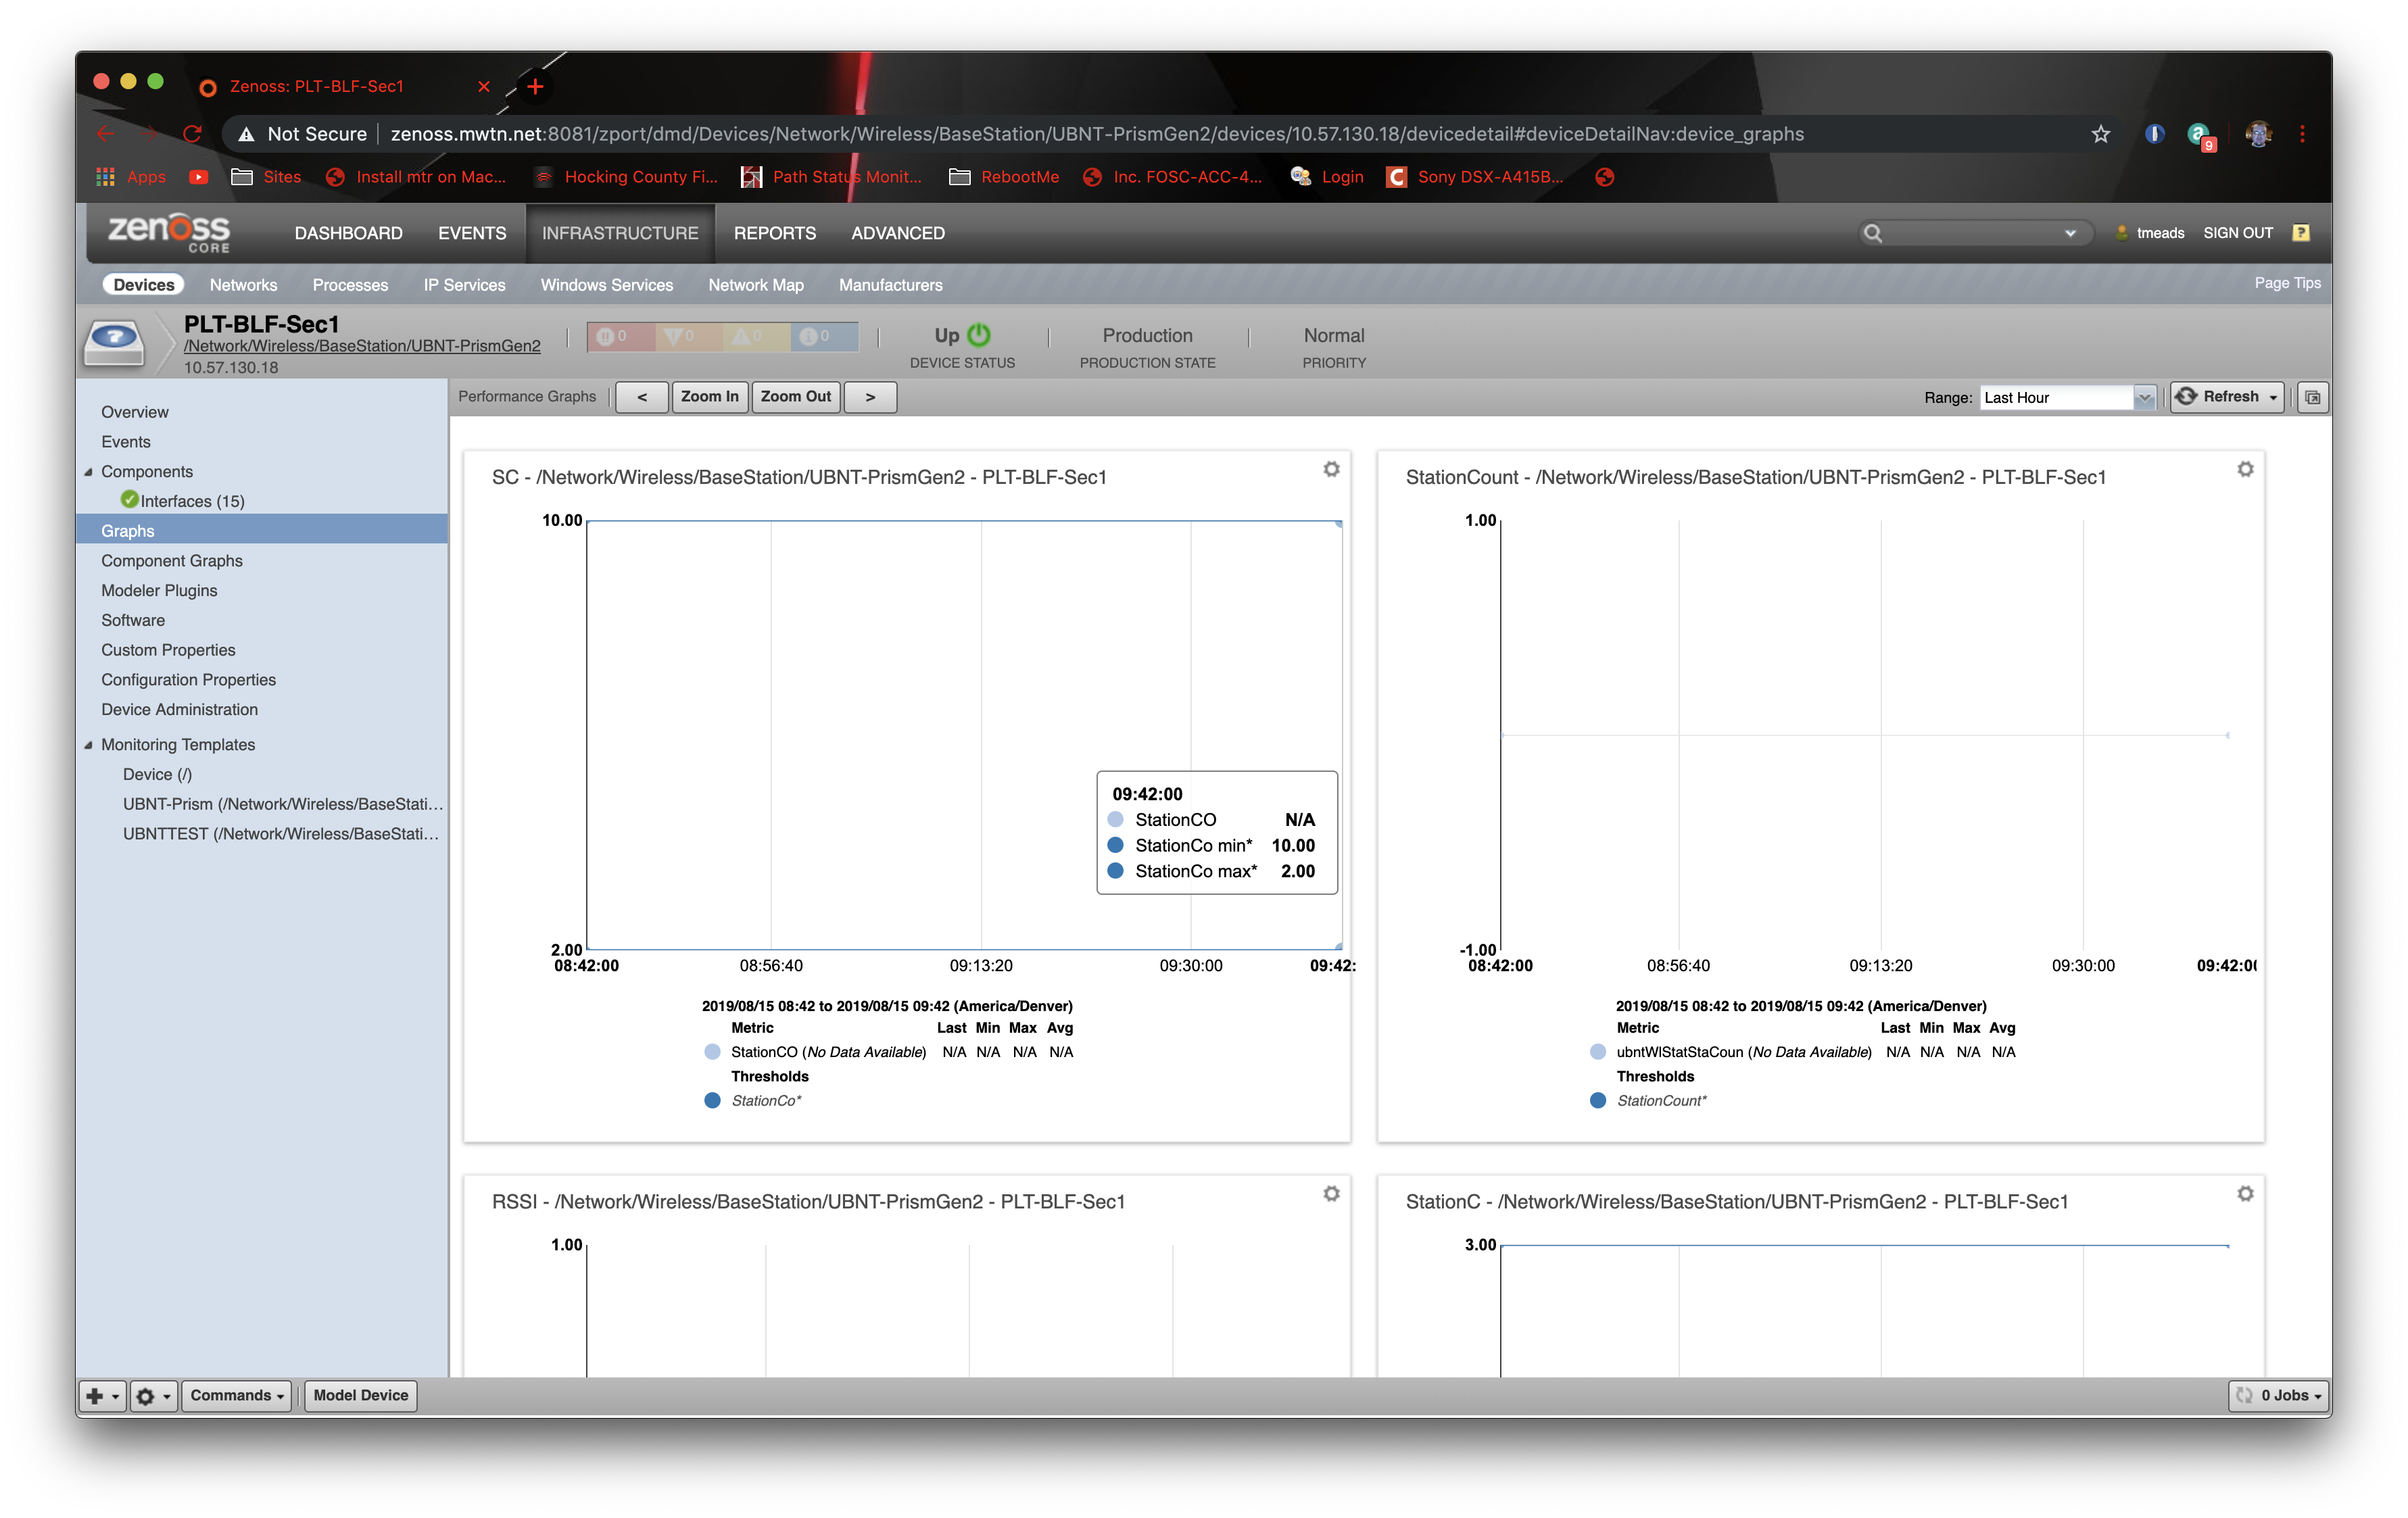
I have completely reconstructed this setup and I'm not getting any data in the graphs being generated by the monitoring template. On the other hand, I can get graphs related to interfaces and such automatically being pulled when the device is being modeled.
Attempting from inside the container,
root@zenoss [~] : serviced service attach zenperfsnmp/0
.1.4.5.1.157279e20 /]# snmpwalk -On -cmWtCorp -v1 10.58.21.9 .1.3.6.1.4.1.41112
.1.3.6.1.4.1.41112.1.4.5.1.15.1 = Gauge32: 6
[root@dfcb77279e20 /]#
I ran the command you wanted me to test with the output. I've attached it to the thread.....I don't really see anything that screams to me as an issue. I've also attached screenshots showing the issue. As I said before, the data for the interfaces comes through without issue, in the output of the file there is no mention of the OID that I'm trying to pull from the monitoring template. Which is .1.3.6.1.4.1.41112.1.4.5.1.15
Attachments:
10.57.130.18.txt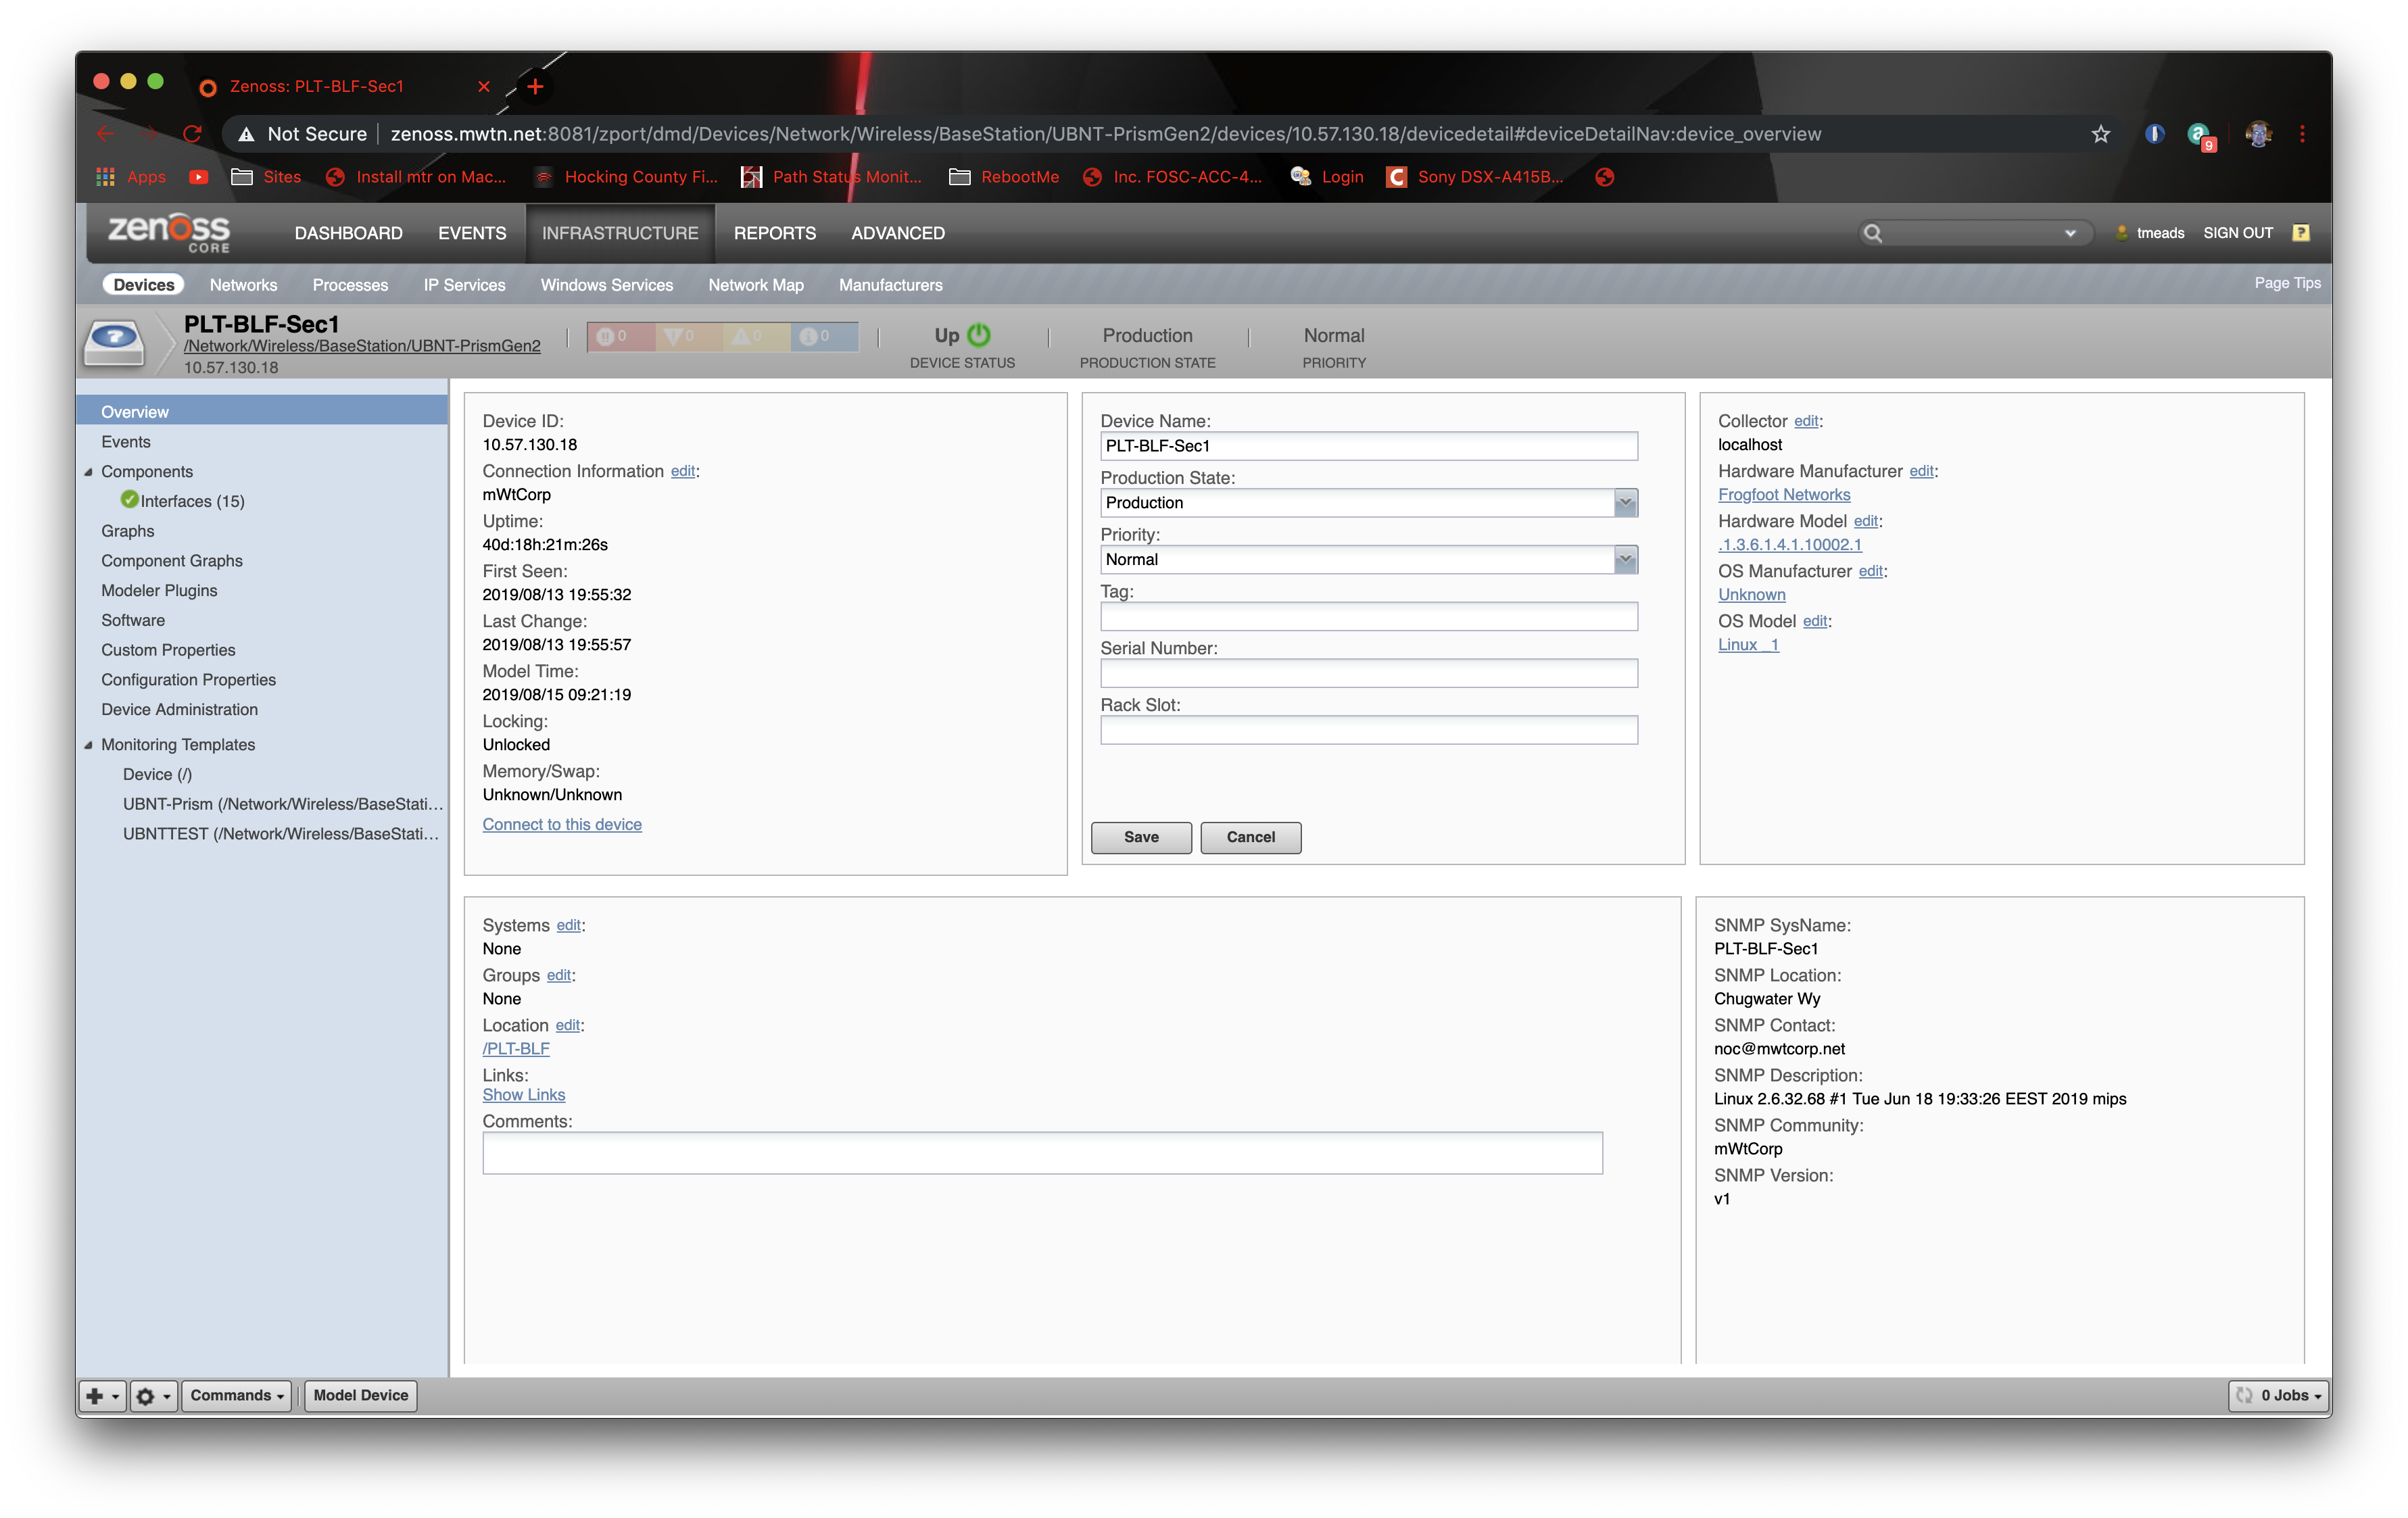
| Subject: | RE: Monitoring Template not working |
| Author: | Jane Curry |
| Posted: | 2019-08-15 12:16 |
| Subject: | RE: Monitoring Template not working |
| Author: | Tim Meads |
| Posted: | 2019-08-15 18:31 |
You are an animal!
So I ran them with a .0 at the end, didn't return a result, so I ran them with a .1 incase that would be the first result under that table and it worked!
tmeads@MacBookTouch2 [~] : snmpwalk -cmWtCorp -v1 -On 10.57.130.18 .1.3.6.1.4.1.41112.1.4.5.1.15
.1.3.6.1.4.1.41112.1.4.5.1.15.1 = Gauge32: 0
tmeads@MacBookTouch2 [~] : snmpwalk -cmWtCorp -v1 -On 10.57.130.18 .1.3.6.1.4.1.41112.1.4.5.1.15.0
tmeads@MacBookTouch2 [~] : snmpwalk -cmWtCorp -v1 -On 10.57.130.18 .1.3.6.1.4.1.41112.1.4.5.1.15.1
.1.3.6.1.4.1.41112.1.4.5.1.15.1 = Gauge32: 0
I now go into the monitoring template graphs and they have the data and I'm getting my alerts. Now if I can just remember all of this stuff the next time the system decides to take a crap ;)
One more question that you may know about....I'm getting utilization errors on interfaces for a radio type thats new. I never had to deal with these before and they keep coming back. I would assume I can put an RRD string somewhere or something similar to make it legible but how does it determine if the interface is at capacity or nearing and throwing the error? These radios do far more then 100meg and I'd assume that's what its erroring on.
Attachments:

| < |
Previous Inverting Ping Events? |
Next Has Zenoss dropped support for Core and the Community? |
> |