| Subject: |
RE: Gaps in graphs when monitoring Windows Server 2018 on https (port 5986) |
| Author: |
Florin Lupean |
| Posted: |
2018-09-24 09:42 |
"Are there any events on the Windows server side?"
R: No. Actually this servers are also monitored using a Zenoss 4.2.4, and the graphs are displayed normal. We have the gaps problems only with Zenoss 6.1.2.
"Do you have blocking timeouts set in ZenPython?"
R: In
/opt/zenoss/ZenPacks/ZenPacks.zenoss.PythonCollector-1.9.0.egg/ZenPacks/zenoss/PythonCollector I found this: parser.add_option(
'--blockingtimeout',
dest='blockingTimeout',
type='float',
default=30.0,
help="Disable plugins that block for X seconds")
I modified the default value to 0 and restarted the services, but we still have those gaps.
"What does a debug collection run show?"
R: I ran this command :
zenmodeler run -v10 --collect=IpInterface -d build.zenoss.loc , but I didn't find any errors. The only error I found was in Zenoss.Core logs and sounds like this :
WARNING zen.python: Task xx.xx.xx.xx 300 Windows Perfmon blocked for 4.44 seconds in collect, Task xx.xx.xx.xx 300 Windows Perfmon blocked for 4.44 seconds in collect.
"How many devices / windows devices do you have per ZenPython container?"
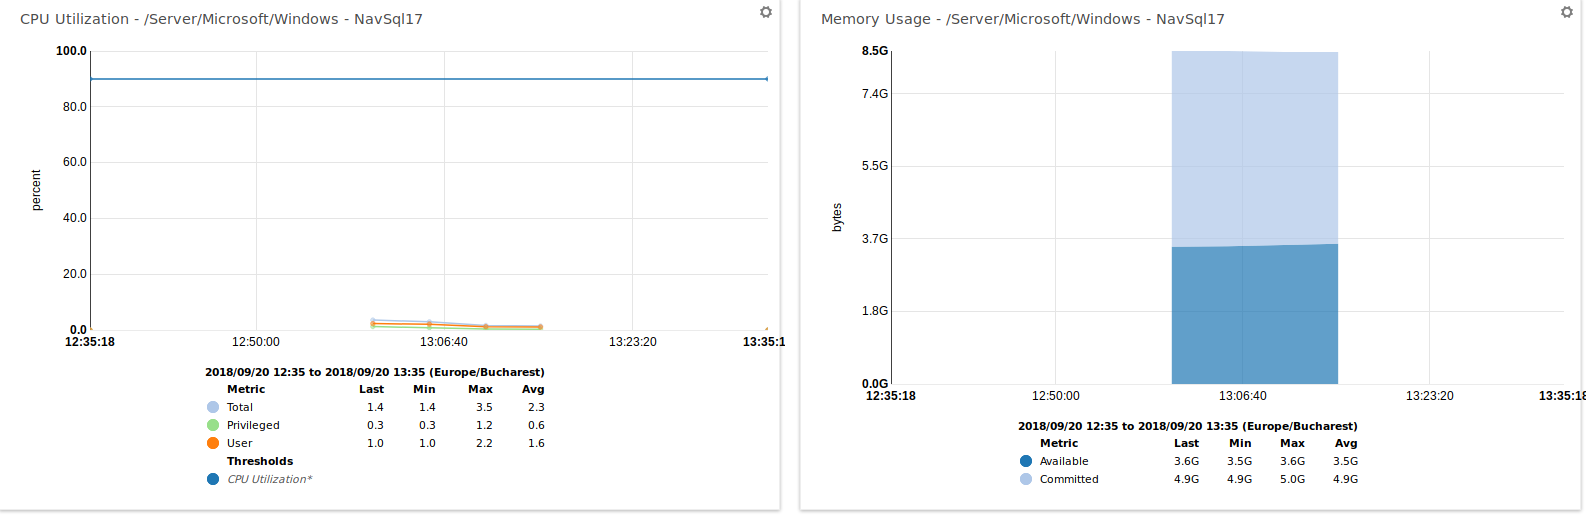
R: 4 Windows devices and the awkward thing is that the graphs start and stop at the same time on each server.
------------------------------
Florin Lupean
Junior DevOps Engineer
Evozon Systems
Sebes
------------------------------