


|
|
| Subject: | Events stop every 80 minutes |
| Author: | [Not Specified] |
| Posted: | 2017-04-24 10:10 |
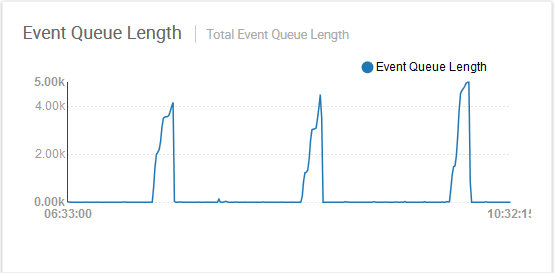
Every 80 minutes SOMETHING is happening causing communication to stop. The biggest tip is the event queue length for zenpython. Like clockwork, it will climb for 10 minutes and then drop back down to 0.
The cause of this issue is with the "Config Cycle Interval" setting for the collector. I have it set at 20 minutes. Every 20 minutes device configs are pulled back by zenhub. I see a huge increase in network traffic and CPU load for a few minutes during this time. Every 80 minutes Windows device configs are pulled back. It takes the worker 3-4 minutes to pull the data. Zenpython is doing the work and is also handling regular data and events that are coming in. It takes 10 minutes for the zenpython event queue to clear out. I've reattached my zenpython event queue graph.Attachments:
| Subject: | RE: Events stop every 80 minutes |
| Author: | Jane Curry |
| Posted: | 2017-05-30 09:32 |
| Subject: | RE: Events stop every 80 minutes |
| Author: | Brian Schimmoller |
| Posted: | 2017-06-07 11:16 |
| Subject: | RE: Events stop every 80 minutes |
| Author: | Jane Curry |
| Posted: | 2017-06-12 08:17 |
| Subject: | RE: Events stop every 80 minutes |
| Author: | Jane Curry |
| Posted: | 2017-06-19 14:01 |
| Subject: | RE: Events stop every 80 minutes |
| Author: | Brian Schimmoller |
| Posted: | 2017-06-20 08:43 |
| Subject: | RE: Events stop every 80 minutes |
| Author: | Jane Curry |
| Posted: | 2017-06-20 14:02 |
Every 80 minutes SOMETHING is happening causing communication to stop. The biggest tip is the event queue length for zenpython. Like clockwork, it will climb for 10 minutes and then drop back down to 0.
I've been troubleshooting this for about a week and I can't track down the root cause. I'm thinking it's something to do with docker communication, but I can't prove it.
Occassionally during this time, I'll get the following zenpython logs:
April 24th 2017, 03:33:01.847 0 2017-04-24 07:33:01,278 WARNING zen.MicrosoftWindows: network error on : timeoutApril 24th 2017, 03:33:01.847 0 2017-04-24 07:33:01,280 WARNING zen.MicrosoftWindows: network error on : timeoutApril 24th 2017, 03:33:01.847 0 2017-04-24 07:33:01,281 WARNING zen.MicrosoftWindows: network error on : timeoutApril 24th 2017, 03:33:01.847 0 2017-04-24 07:33:01,282 WARNING zen.MicrosoftWindows: network error on : timeoutApril 24th 2017, 03:33:01.847 0 2017-04-24 07:33:01,287 WARNING zen.MicrosoftWindows: network error on : timeoutApril 24th 2017, 03:33:01.847 0 2017-04-24 07:33:01,289 WARNING zen.MicrosoftWindows: network error on : timeoutApril 24th 2017, 03:33:01.847 0 2017-04-24 07:33:01,298 WARNING zen.MicrosoftWindows: network error on : timeoutApril 24th 2017, 03:33:01.847 0 2017-04-24 07:33:01,319 WARNING zen.MicrosoftWindows: network error on : timeoutApril 24th 2017, 03:33:01.847 0 2017-04-24 07:33:01,324 WARNING zen.MicrosoftWindows: network error on : timeoutApril 24th 2017, 03:33:01.847 0 2017-04-24 07:33:01,324 WARNING zen.MicrosoftWindows: network error on : timeoutApril 24th 2017, 03:33:01.847 0 2017-04-24 07:33:01,325 WARNING zen.MicrosoftWindows: network error on : timeoutApril 24th 2017, 03:33:01.847 0 2017-04-24 07:33:01,326 WARNING zen.MicrosoftWindows: network error on : timeoutApril 24th 2017, 03:33:01.847 0 2017-04-24 07:33:01,327 WARNING zen.MicrosoftWindows: network error on : timeoutApril 24th 2017, 03:32:55.846 0 2017-04-24 07:32:55,599 WARNING zen.MicrosoftWindows: network error on : timeoutApril 24th 2017, 03:32:55.846 0 2017-04-24 07:32:55,608 WARNING zen.MicrosoftWindows: network error on : timeoutApril 24th 2017, 03:32:55.846 0 2017-04-24 07:32:55,609 WARNING zen.MicrosoftWindows: network error on : timeout
But I don't get ping timeouts, the graph data doesn't seem to skip a beat, just the event counts stop for 10-15 minutes. Once the 10 minutes are up, event counts catchup and I receive new events.
After the 10 minutes is up, I get this elastic search error mentioning a 10 minutes timeout. I'm just not sure if this is the cause or the effect of my problem and I'm not sure what elastic search provides.
Has anyone seen this before? Anyone have any idea what might be happening every 80 minutes?
I can provide more logs, if needed, but I don't want to just dump everything out here.
| < |
Previous upgraded to core 5.2.3 - help |
Next Permmission problem on Devices |
> |