

|
|
| Subject: | Realtime graphs? |
| Author: | Joan |
| Posted: | 2014-09-01 02:19 |
Before working with zenoss, I use cacti to monitor my hosts, one thing I miss is the function that allowed to monitor a specific graph in continuous polling (from 1 to 30 sec) that allowed to view some important stuff.
The link for cacti is this: http://docs.cacti.net/plugin:realtime
Is there anything like this achievable with zenoss
Regards,
Joan
| Subject: | Dirty hack: |
| Author: | Jan Garaj |
| Posted: | 2014-09-03 18:26 |
Dirty hack:
Edit Refresh button definition in /opt/zenoss/Products/ZenUI3/browser/resources/js/deploy/zenoss-compiled.js
Change:
},{
xtype: 'menucheckitem',
text: '1 minute',
value: 60,
group: 'refreshgroup'
},{
=>
},{
xtype: 'menucheckitem',
text: '10 seconds',
value: 10,
group: 'refreshgroup'
},{
...
And then CTRL+F5 (full cache reload) in your browser.
This is for Zenoss 4.2.5 - original source is /opt/zenoss/Products/ZenUI3/browser/resources/js/zenoss/form/graphPanel.js, but I don't know how to compile this js file into final js.
Devops Monitoring Expert advice:
Dockerize/automate/monitor all the things.
DevOps stack:
Docker / Kubernetes / Mesos / Zabbix / Zenoss / Grafana / Puppet / Ansible / Vagrant / Terraform /
Elasticsearch
| Subject: | Would this make the reloading |
| Author: | Joan |
| Posted: | 2014-10-06 08:48 |
Would this make the reloading of the graphs faster o increase the polling frequency too I am interested on the second mostly (it's great to debug newly created graphs)
Regards
| Subject: | Nope, this is just frontend |
| Author: | Jan Garaj |
| Posted: | 2014-10-06 11:11 |
Nope, this is just frontend change - it's only for reloading of graphs.
Polling frequency:
- you will need to setup relevant zendeamon (zenperfsnmp, ..) or datasource
- you will need to recreate rrd files with new polling frequency (the easiest way is to remove old rrds)
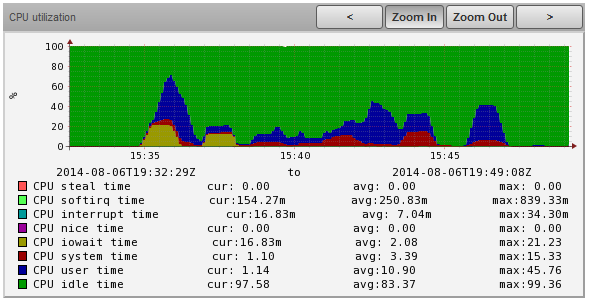
IMHO Zenoss one second polling is very CPU intensive, so don't forget to watch CPU utilization on your zenoss server. It's possible anyway. My test graph with one second zencommand polling
https://raw.githubusercontent.com/jangaraj/ZenPacks.JanGaraj.ZabbixAgent...
Devops Monitoring Expert advice:
Dockerize/automate/monitor all the things.
DevOps stack:
Docker / Kubernetes / Mesos / Zabbix / Zenoss / Grafana / Puppet / Ansible / Vagrant / Terraform /
Elasticsearch
| Subject: | Thanks for your followup, |
| Author: | Joan |
| Posted: | 2014-10-16 02:24 |
Thanks for your followup, unfortunately this is not what I need, basically for most of the time the standard polling is just fine for me, only on some special cases I would like to make it more frequent (when troubleshooting mostly), and ideally I would like to have a parallel grap for that specific metric that I can throw away afterwards.
Regards
| Subject: | Hi, |
| Author: | Andrew Kirch |
| Posted: | 2014-10-20 09:11 |
Hi,
I get this desire, in fact it's nearly a FAQ at this point. That said continuous polling of a resource is generally speaking a bad idea because it increases load both on the network monitor, and the device you're polling. "Gee, I wonder if this switch is overloaded, lets generate more load to find out!"
Almost everything that isn't a server has insufficient CPU to deal with this in a reasonable manner. Polling becomes an issues as well. In the end a network switch is a high speed electrical switch, so at some point the status of the link is either 100% saturated, or 0% saturated. This point has been made quite a few times when the subject of real-time polling was brought up on NANOG. If you still want to add this functionality though, I would suggest joining us for Dev Hours and writing a ZenPack.
Andrew Kirch
akirch@gvit.com
Need Zenoss support, consulting or custom development Look no further. Email or PM me!
Ready for Distributed Topology (collectors) for Zenoss 5 Coming May 1st from GoVanguard
| < |
Previous Can I choose the polling method for a specific OID? |
Next Alert Memory and CPU Usage of process dynamically by using zenoss. |
> |