TECHZEN Zenoss User Community ARCHIVE  

Querying OpenTSDB for one metric across multiple devices

Subject: Querying OpenTSDB for one metric across multiple devices
Author: Michael Ermino
Posted: 2020-02-06 16:45

Due to security requirements, we're forced to migrate from Zenoss 4 to Zenoss 6. Currently with Zenoss 4 we have a Graphite instance that reads the RRD files which is added as a datasource in Grafana to create dashboards. With Graphite I can create a wildcard query to pull in metrics from multiple devices into a single graph. However with OpenTSDB, I'm having trouble pulling in multiple devices with one query. According to the OpenTSDB documentation a query requires a start time, metric, and aggregation function. The metric needs to be the full name of the metric in the system. What I've noticed is that Zenoss 6 prepends the device id to the metric instead of using a tag.

Ex. server01.example.com/laLoadInt15_laLoadInt15

Since the query requires the full metric name, I cannot create a query where metric=server*/laLoadInt15_laLoadInt15

From what I've read, the OpenTSDB documentation says you can use wildcards in tags, however because the device id is prepended to the metric I can't make a single query to pull one metric across multiple devices. Instead I have to create separate queries for each device for the same metric. Some dashboard graphs have over 50 devices displayed on one graph, which means I would need to create 50 separate queries to pull the data. Also because OpenTSDB needs the full metric name, if a device is added I would need to add the query manually to the dashboard to pull in the new device. In Graphite, the wildcard would just pull in the new device automatically.

I'm also concerned that making these separate queries would cause performance issues on the OpenTSDB instance when multiple users are looking at the Grafana dashboard.

I guess my question is: with the current way Zenoss 6 saves metric data, is there a way to make a single OpenTSDB query and get time series data for a single metric returned from multiple devices? Is there a reason why Zenoss 6 prepends the device id to metric names vs. just having the metrics name and adding a device id tag to it? (Ex. laLoadInt15_laLoadInt15 device=server01.example.com)

------------------------------
Mike
------------------------------


Subject: RE: Querying OpenTSDB for one metric across multiple devices
Author: Michael Rogers
Posted: 2020-02-06 19:04

Mike,

The OpenTSDB query format won't allow you to use wildcards in the metric name, but you can supply multiple metrics in a single query.  To confirm this, I made a sample multi-graph report on a test instance, and configured it to throw all the graphed metrics on a single graph.  The query pulled the uptime_laLoadInt15 datapoint for 23 monitored devices.  Mind you, every one of those metrics included the device ID, along with a tag for the device ID as well.  

If you have a list of every device you'll need to pull (or if you can generate such a list programatically), you can still pull this off.


------------------------------
Michael J. Rogers
Senior Instructor - Zenoss
Austin TX
------------------------------

Subject: RE: Querying OpenTSDB for one metric across multiple devices
Author: Michael Rogers
Posted: 2020-02-06 19:06

I tweaked the report down to a mere two devices so that I could share the payload without redacting 23 host names.  I came up with this:

{"start":1580947368865,"end":1581033768865,"series":true,"downsample":"5m-avg","tags":{},"returnset":"EXACT","metrics":[{"metric":"redacted-01/uptime_laLoadInt15","id":"bjyDKLB9Ja","rate":false,"rateOptions":{},"aggregator":"avg","tags":{"key":["Devices/redacted-01"]},"name":"redacted-01 laLoadInt15"},{"metric":"redacted-02/uptime_laLoadInt15","id":"Ye8Szofrbb","rate":false,"rateOptions":{},"aggregator":"avg","tags":{"key":["Devices/redacted-02"]},"name":"redacted-02 laLoadInt15"}]}

I hope this helps!

------------------------------
Michael J. Rogers
Senior Instructor - Zenoss
Austin TX
------------------------------


Subject: RE: Querying OpenTSDB for one metric across multiple devices
Author: Michael Ermino
Posted: 2020-02-06 19:36

Thanks for the quick response Michael.  I'm using Grafana's Query editor to build the query and show the data on a line chart.  I'm not exactly sure how to translate the info you provided into this query form.  For example, I'd like to show the 5 min load for a cluster of servers on one graph.  The only way I'm able to do this in Grafana is to have a separate query for each of the servers, which isn't optimal.  If a new server is added to the cluster, then I would need to manually add that query to the Grafana line chart.   


------------------------------
Mike
------------------------------


Subject: RE: Querying OpenTSDB for one metric across multiple devices
Author: Michael Rogers
Posted: 2020-02-07 10:06

I did some quick searching for some sort of "raw query" mode in Grafana's docs, and I came up with this link:

https://grafana.com/docs/grafana/latest/features/datasources/influxdb/#text-editor-mode-raw

As a caveat, my firsthand knowledge of Grafana goes as far as how to spell it, so I'm not sure if the raw mode option there is even for the right data source type.  If the query editor you're using provides some sort of raw mode, you may be able to build the payload you need and drop it in.  Even if that does work, it doesn't solve the problem of adding in each new cluster node by hand after deployment.

------------------------------
Michael J. Rogers
Senior Instructor - Zenoss
Austin TX
------------------------------


Subject: RE: Querying OpenTSDB for one metric across multiple devices
Author: Michael Ermino
Posted: 2020-02-07 12:27

Thanks for the response Michael. Unfortunately there is no raw query mode for the OpenTSDB data source in Grafana.  I'm stuck with their query editor. We might have to look into an alternative solution for our monitoring. Grafana has been an integral part of our operations as it brings all our monitoring data into one central location.

Question about the way Zenoss 6 saves data into OpenTSDB... is there a technical requirement that Zenoss 6 doesn't save metric data as the OpenTSDB documentation recommends? Its very similar to the way data is sent to InfluxDB where tags are used as identifiers for the metric. If metric data was saved using tags instead of prepending the device id to the metric name, then this would make querying easier.

http://opentsdb.net/docs/build/html/user_guide/query/timeseries.html

If there is no technical requirement, is it possible for me to modify the logic that sends data to the OpenTSDB scollector so that the device id is no longer prepended to the metric name and instead added as a tag value? OR is there a way to modify the logic to write the data twice, where the second write would be in the recommended OpenTSDB format? 


------------------------------
Mike
------------------------------


------------------------------
Mike


Subject: RE: Querying OpenTSDB for one metric across multiple devices
Author: Michael Ermino
Posted: 2020-02-11 13:26

Just following up on my last response. Is there a technical requirement to have the device id in the metric name?  If no technical requirement is needed, is there a config setting or perhaps some sort of code change that I can do to remove the device id from the metric name when it is saved to OpenTSDB?

------------------------------
Mike
------------------------------


Subject: RE: Querying OpenTSDB for one metric across multiple devices
Author: Michael Rogers
Posted: 2020-02-13 14:57

I did some asking around on the subject, and there was a valid reason initially (though I haven't been able to determine what that reason was).

Today, the reason is that all of the code that touches performance data expects that format. This isn't user-configurable and there's no handy page or config file where it can be altered. Changing the format of performance metrics would require a re-write to numerous pieces of code throughout several different sections of the product.

The Grafana docs did mention the existence of query variables. Do you know if you can replace the device ID with a variable, and allow it to substitute the device IDs?

------------------------------
Michael J. Rogers
Senior Instructor - Zenoss
Austin TX
------------------------------


Subject: RE: Querying OpenTSDB for one metric across multiple devices
Author: Michael Ermino
Posted: 2020-02-13 18:23

Thanks for doing the legwork and trying to figure this out.

Setting up a query variable to pull just the device id's still isn't possible with the way the metric data is saved by Zenoss 6 and the existing OpenTSDB api endpoints.  Even with the api/suggest endpoint I cannot pull devices that have an arbitrary prefix (ie. 01_server_a, 02_server_a, etc...) as the string match value only matches metrics that start with the given value. 

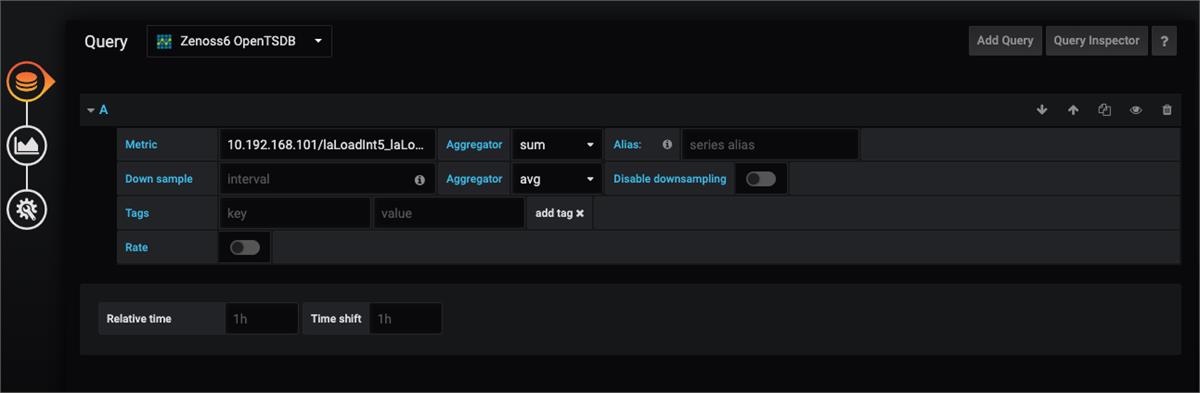
I was afraid that it wasn't going to be a straightforward fix, so I've been working on a "Plan B" which is a process that reads metrics from OpenTSDB every 5 minutes and writes them back to OpenTSDB without the device ID prefixed to the metric name. Using those rewritten metrics I can now perform a single query to one metric (ex. laLoadInt15_laLoadInt15) with a wildcard tag (ex. device=*prod_server*) that pulls all the metrics that contains "prod_server" in its name.  It is definitely not the ideal solution I was looking for, but it works for now. I'm just not sure that this solution is sustainable and how it will affect performance on the OpenTSDB instance.


------------------------------
Mike
------------------------------


Subject: RE: Querying OpenTSDB for one metric across multiple devices
Author: Michael Ermino
Posted: 2020-02-27 19:12

So my solution to read the metrics and rewrite them back to OpenTSDB in the recommended format as stated in the OpenTSDB documentation is proving to be more problematic as I'm seeing performance issues when just trying to read the metrics. Because of the way metrics are stored, I need to make individual requests for each device metric. The OpenTSDB API query endpoint starts failing and timing out.  We've increased the number of opentsdb instances, but it doesn't seem to help.

From what was mentioned earlier in this thread, Zenoss expects metrics in its current format and that there would be major changes needed to change the format of how metrics are written...

Is it possible to modify the code of our Zenoss 6 instance so that when metrics are saved to OpenTSDB it is saved twice?  Once in the format that Zenoss is expecting, and another in the standard OpenTSDB format where the device name is NOT prepended to the metric name? I'm assuming that the MetricShipper service is where the data is sent to OpenTSDB. Is this the right place? Can this be modified to save each metric twice?

------------------------------
Mike
------------------------------

Thanks for the response Michael. Unfortunately there is no raw query mode for the OpenTSDB data source in Grafana.  I'm stuck with their query editor. We might have to look into an alternative solution for our monitoring. Grafana has been an integral part of our operations as it brings all our monitoring data into one central location.

Question about the way Zenoss 6 saves data into OpenTSDB... is there a technical requirement that Zenoss 6 doesn't save metric data as the OpenTSDB documentation recommends? Its very similar to the way data is sent to InfluxDB where tags are used as identifiers for the metric. If metric data was saved using tags instead of prepending the device id to the metric name, then this would make querying easier.

http://opentsdb.net/docs/build/html/user_guide/query/timeseries.html

If there is no technical requirement, is it possible for me to modify the logic that sends data to the OpenTSDB scollector so that the device id is no longer prepended to the metric name and instead added as a tag value? OR is there a way to modify the logic to write the data twice, where the second write would be in the recommended OpenTSDB format?


------------------------------
Mike


------------------------------
Mike


< Previous
Unable to create graph reports in Zenoss 6.2.1 under Reports
  Next
Zenoss server not showing device inventory :
>