No - there is no way. Zenoss is very limited when it comes to customization of its graphs and reports. I would suggest looking at another product like Nagios.
| Subject: |
RE: Creating graphs from IOD with 3 values |
| Author: |
Jay Stanley |
| Posted: |
2019-06-07 09:36 |
Anything you can do in Nagios, you can do in Zenoss.
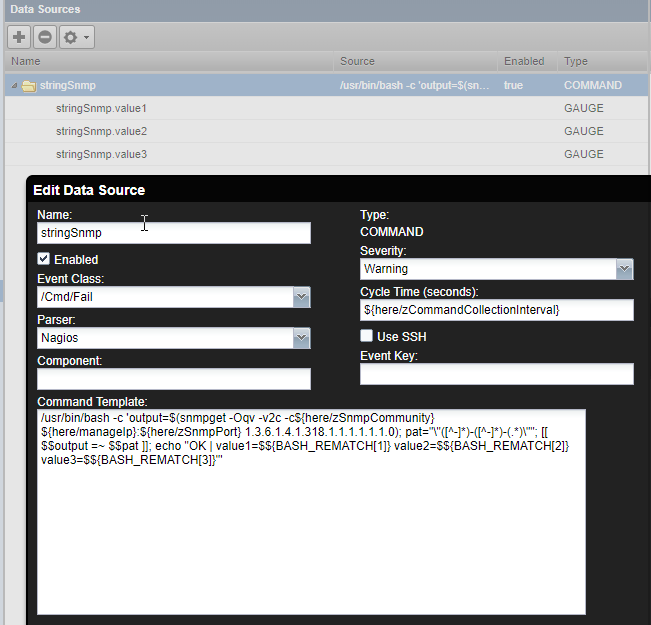
I was able to get this done using a simple CMD datasource (It can be done other ways.. use a script, create a new datasource, etc).
The command I used:
/usr/bin/bash -c 'output=$(snmpget -Oqv -v2c -c${here/zSnmpCommunity} ${here/manageIp}:${here/zSnmpPort} 1.3.6.1.4.1.318.1.1.1.1.1.1.0); pat="\"([^-]*)-([^-]*)-(.*)\""; [[ $$output =~ $$pat ]]; echo "OK | value1=$${BASH_REMATCH[1]} value2=$${BASH_REMATCH[2]} value3=$${BASH_REMATCH[3]}"'
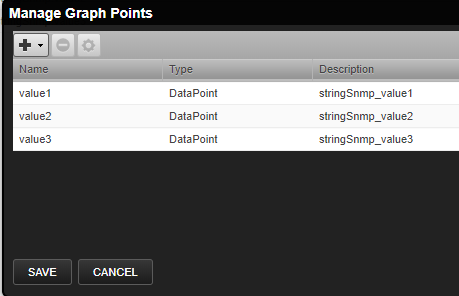
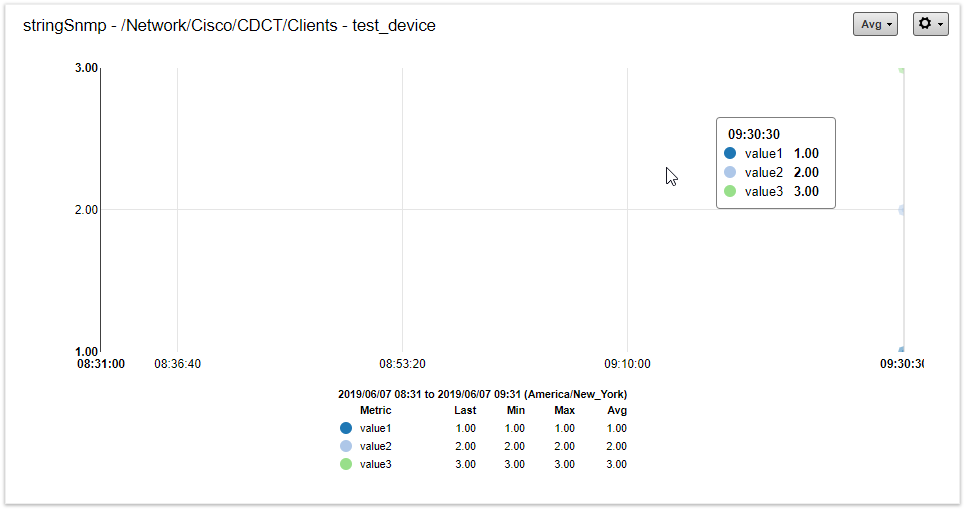
I added 3 datapoints (value1, value2, value3), then added those to a graph.
------------------------------
jstanley
------------------------------

